Mine planners are frequently asked to generate a series of schedules which represent strategies for their businesses under varying market conditions. These conditions are often represented by some kind of informed commodity price forecast, though it is not my intention to discuss price forecasts here. However, for these given forecasts, I would like to show how modelling a more comprehensive options costing framework can have a meaningful impact on the strategy for a mine.

The Situation and the Pitfalls with a Traditional Approach
Let’s look at a situation when the forecasted price path falls into pessimistic territory and the margin squeeze begins. In this case, mine planners who use the traditional simple OPEX-based costing model may decide that it is more economic to shut down one or more parts of the operation for the period of decline. This is because the traditional approach has no penalty associated with shutting down, except the opportunity cost captured in the discount rate. However, shutting down infrastructure (as well as re-starting it in future periods) has a cost, and this cost should be considered in addition to business-as-usual outlays when deciding whether or not to shut down.
An Example
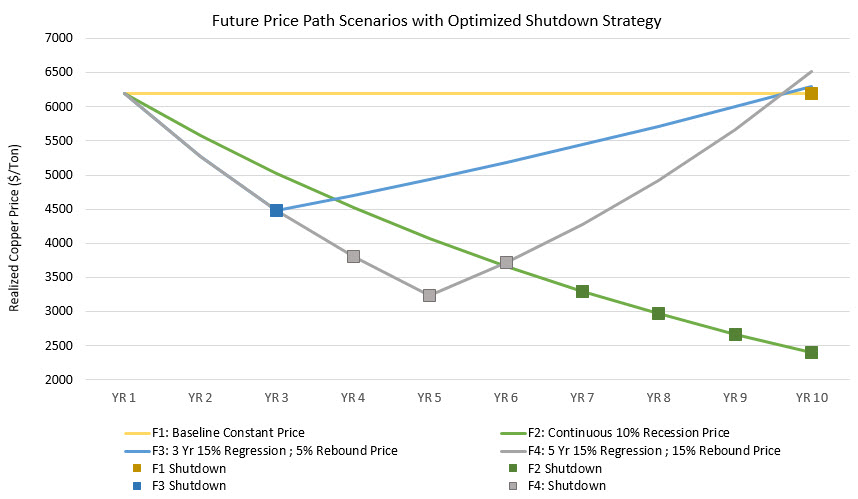
To illustrate this situation I have developed an example of an open pit mine faced with a series of possible pessimistic future conditions. These conditions are represented by four different forecasts for copper over a ten year period:
- Forecast 1: Current Cu price remains stable throughout the schedule (baseline case)
- Forecast 2: Continuous 10% Cu price recession Years 1-10 (the sky is falling case)
- Forecast 3: 3 Year sharp (15%) Cu price regression followed by a slow 5% recovery Years 4-10
- Forecast 4: 5 Year sharp (15%) Cu price regression followed by a rapid 15% recovery Years 6-10
For each forecast, we must determine the strategy for the business: whether to operate, shut down or choose some combination of the two.
The Methodology
I modeled this example using an integrated optimization approach. The cut-off grade and material destinations of the mine are not pre-defined as the optimization will determine them based on the economic conditions and operating constraints (including a maximum milling constraint). There is no stockpiling in this model. A constant 10% discount rate is applied to calculate the net present value. I modelled the fixed costing environment using six possible operating options for each period, the combination of which forms the operating strategy of the business for each ten year scenario.
- Operate the Mine and Mill ($200M pa)
- Operate the Mine (waste stripping only) and Idle the Mill ($120M pa)
- Shut Down (+Care and Maintenance, Dewatering) for 1 Year and Restart ($90M pa)
- Shut Down (+Care and Maintenance, Dewatering) for 2 Years and Restart ($130M pa)
- Shut Down (+Care and Maintenance, Dewatering) for 3 Years and Restart ($170M pa)
- Shut Down (+Care and Maintenance) for Duration, No Restart ($140M pa)
I associated scalable tonnage and mining activities with variable costs (e.g.: pcost is in $/tonne, haulage cost is in $/hour, etc.). The key to this method is to include the fixed period-based cost options (e.g.: costs of shutting down, operating and restarting) in addition to the operational-based unit costing elements for each scenario as inputs into the optimization. To find the combinations of options which form the schedule with the highest NPV, I solved the problem with global optimization, which considers all periods simultaneously. The selection of the optimum option combination is accomplished within the optimization itself, and not as a post-scheduling cash flow evaluation. Sometimes in strategic mine plans, we “do nothing” to avoid any type of fixed costs, but this isn’t possible in real life, so it shouldn’t be an option for our mine plan.
The Results
Finding the optimal schedule using a global optimization is not straightforward. This is because the periodic variability in each of the price profiles must be leveraged, together with the known fixed cost options, to deliver the schedule with the maximum NPV. The following chart shows the periods when the mine should be shut down in order to maximize NPV; square markers reveal the periods for shutdown for each scenario.

The worst case scenario (F2), demonstrated by a continuous 10% price regression, indicates that the mine and mill should persist operating until the price falls below $3500/t (YR7) and remain closed as the price continues to fall. The short term recession/slow recovery scenario (F3) indicates the best strategy for the business under these conditions is a single period mine and mill shut-down when the price falls below $4500/t (YR3), followed by continuous operations beyond. The medium term recession/aggressive recovery scenario (F4) indicates that the best strategy for the business is a mine and mill closure for the three lowest price years when the price falls below $4000/t (YR4-YR6), then resume operating in YR7 as the price recovers.
Comparison with the Traditional OPEX-based Approach
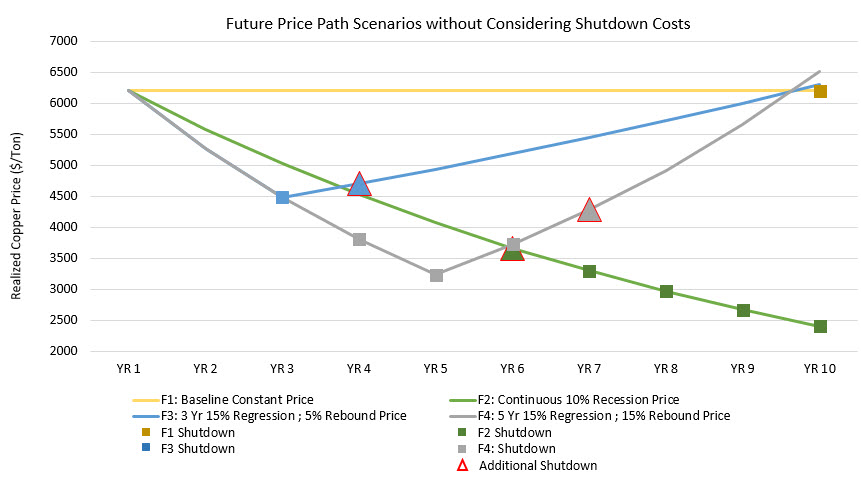
To confirm my methodology, I decided to compare my results with results using the traditional OPEX-based approach. If I took the shutdown costs out of the optimization process, what would the schedules look like? For all four forecasts, I modelled the same scenarios again with variable costs (only). But this time, the costs are only incurred during active periods of mining and processing, which is similar to the way many traditional models are set up. Here’s what happened:

The results indicate that for the traditional approach there are additional shutdown periods (indicated by triangles), confirming that solving without the shutdown costs penalty directly affects the schedule results for this example mine.
Summary
This simple study only scratches the surface of this topic, however, it demonstrates how an additional, defined options framework for fixed costing (such as shutdown and restart costs) can significantly influence your strategic schedule. In general, when you add more information to the framework for your decision, you will get a more realistic result. The traditional approach lacks this framework and does not consider all factors when optimizing the schedule. This incomplete scenario may mislead you into following a flawed strategy of shutting down for longer periods of time, and ultimately missing out on value that is crucial in challenging economic times. What approach are you using to define real operating options in the face of future conditions? Share this on social media or by using the contact form below.
Notes
- The scope of this article is limited to the strategic schedule optimization component of the mine planning value chain. In situations where there are significant, lasting, or structural adjustments to the economic parameters, we advise the mine planner to go all the way back to revisit the pit/phase optimization procedures.


